Calculating Burn Rates in J
In January I start EMT Training and maybe make at least one of my childhood dreams come true. I’ve been saving for years for this: while the program is cheap, I’m effectively losing my monthly salary. I found it really easy to calculate my burn rate in J. I’ve talked about J before so I’ll assume you know the basics and we can skip all of that.
Note: Just to be absolutely clear, the numbers below are made up. I’m not living off 500 dollars a month.
Basics
First some warmups. Let’s assume I have 3000 dollars in my bank account and estimate my spending at 600 a month. How long can I live off my savings? That’s a pretty trivial calculation in any language.
   3000 % 600
5
Great, but 600 is just an estimate. I’m going to have to start paying for my own health insurance, but I’m also going to live more frugally. Let’s say my uncertainty is about a 100 dollars in either direction, so I could be spending as low as 500 or as much as 700. How much time do I have for each rate?
In most languages, I’d have to use a loop or a map. But J is designed from ground up to work with arrays. If you do a binary operator on two equal length arrays, it will operate elementwise.
   3000 3000 3000 % 500 600 700
6 5 4.28571
If the arrays are different lengths? For most operators, this breaks. But if you just have one number, that’s not a length-one array. It’s just an “atom”, or scalar. You can divide an array by an atom or vice-versa: just stretch the atom into a same-size array.
r =: 500 600 700 NB. Rate of spend
   3000 % r
6 5 4.28571
Tables
I have 3000 dollars in my bank account right now. One thing I forgot to account for is my FSA: I have, say, 1000 in refunds I can get from my pharmacy. I want to see how many months I have both with and without the FSA money.
s =: 3000 4000 NB. Savings
 3000 4000 % r
|length error
Oh right, arrays of different lengths. What I want is 3000 % r and 4000 % r independently. To do with we use the table adverb. +/ creates an addition table and */ is a multiplication table.1
   1 2 3 4 */ 1 2 3 4
1 2  3  4
2 4  6  8
3 6  9 12
4 8 12 16
By extension, %/ is the ‘division’ table, aka the number of months per initial savings and rate of spend.
   3000 4000 %/ r
6       5 4.28571
8 6.66667 5.71429
That tells me how many months I’d have, but I want something a little more detailed. I’d like to know, for a given savings and rate of spend, how much I’d have each month. Since the rate of spend is fixed, at month t I’d have s - r*t left. That’s easily representable by a 3D table. First, we get the r*t table:
   i.7
0 1 2 3 4 5 6
   r */ i.7
0 500 1000 1500 2000 2500 3000
0 600 1200 1800 2400 3000 3600
0 700 1400 2100 2800 3500 4200
This table is a rank 2 array. Rank 1 arrays like s and r are commonly called lists. As with lists, you can subtract an rank 2 array from an atom, which produces a new table.
   2000 - r */ i.7
2000 1500 1000  500    0  _500 _1000
2000 1400  800  200 _400 _1000 _1600
2000 1300  600 _100 _800 _1500 _2200
Since that works, -/ will also work. Just as making a ‘table’ out of two lists gave us a table, making a ‘table’ out of a list and a table will give us a rank 3 array.
   ] burnrate =: s -/ r */ i.7
3000 2500 2000 1500 1000  500     0
3000 2400 1800 1200  600    0  _600
3000 2300 1600  900  200 _500 _1200

4000 3500 3000 2500 2000 1500  1000
4000 3400 2800 2200 1600 1000   400
4000 3300 2600 1900 1200  500  _200
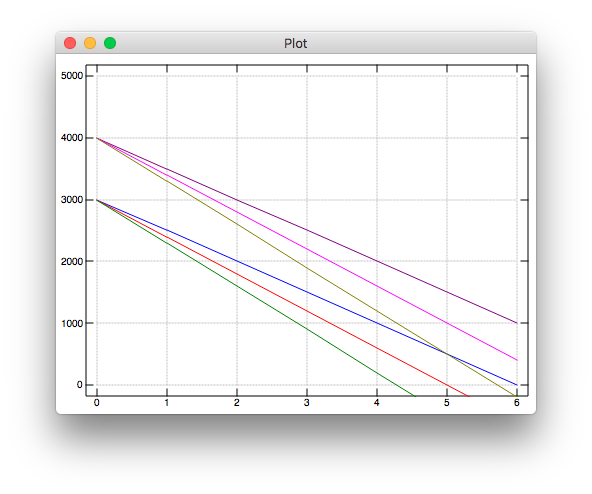
There’s three dimensions here: initial savings, rate of spend, and time. We represent the third dimension by the empty newline between the first 2D table in burnrate and the second. For a rank 4 array, we’d have two empty lines between each ‘brick’ in it. Most monads2 in J can operate on arrays of arbitrary rank, and we’ll see why that’s useful in the next section.
In the meantime, let’s use the plot package to see what our finances look like.
load 'plot'
'yrange 0 5000' plot burnrate
Prefixes
What if I don’t leave my job immediately? At most I’m willing to work three more months. For every extra month, I make a 500 dollar profit. This is independent of my monthly expenses.3 My savings per month are no longer a linear function of time, and I can’t just add the arrays together. Instead, let’s do this with a reduce. We’ll get a given month’s savings by subtracting the spend (or add the income) to the previous month’s value.
First, since we’re dealing with both positive and numbers, let’s make r negative. Since - is a verb, we represent negative x as _x. I’ll also reduce the size of s and r to make the examples smaller.
r =: _500 _600
s =: 3000
The accumulate adverb is /\. We know / is the reduce/table adverb. \ is the prefix adverb. f\ x applies f to every prefix of x.
   ]\ 'abc'
a
ab
abc
Hopefully you can see why /\ is accumulate. +/\ 1 2 3 is the array 1 (1 + 2) (1 + 2 + 3).
For real numbers (+ a) = a, so +\ just gives us a triangle matrix.
   ] income =: +\ 3 # 500
500   0   0
500 500   0
500 500 500
But we actually want six months, so let’s slap some extra zeros on there.
NB. There's probably a better way to do this
   ] income =:  0 ,.~^:3 +\ 3 # 500
500   0   0 0 0 0
500 500   0 0 0 0
500 500 500 0 0 0
Next I wrote a fill dyad that uses ‘gerunds’ to combine two verbs. The implementation is a bit out of scope, but all it does is replace 0’s in array with a given atom.
   fill =: (]`[)@.((0&=)@:])"0
   9 fill income
500   9   9 9 9 9
500 500   9 9 9 9
500 500 500 9 9 9
r is a list, so we can’t do r fill income. Instead, let’s make another table!
   r fill/ income
500 _500 _500 _500 _500 _500
500  500 _500 _500 _500 _500
500  500  500 _500 _500 _500

500 _600 _600 _600 _600 _600
500  500 _600 _600 _600 _600
500  500  500 _600 _600 _600
+/\ r fill/ income will accumulate over the tables, but we want to accumulate over the elements of each row in the table. Most verbs in J work on arbitrary arrays, so applying verbs subarrays is a common problem. We handle that with the “rank” conjunction: f"n x applies f to the rank-n subarrays of x. r fill/ income is rank 3. +/\ accumulates over the tables, +/\"2 accumulates over the rows in each table, +/\"1 accumulates over the elements in each row, and +/\"0 doesn’t really do anything. We want +/\"1.
   ] results =: +/\"1 r fill/ income
500    0 _500 _1000 _1500 _2000
500 1000  500     0  _500 _1000
500 1000 1500  1000   500     0

500 _100 _700 _1300 _1900 _2500
500 1000  400  _200  _800 _1400
500 1000 1500   900   300  _300
Now let’s slap on an initial time, add our savings to every atom, and plot it!
plot s + 0 ,"1 results
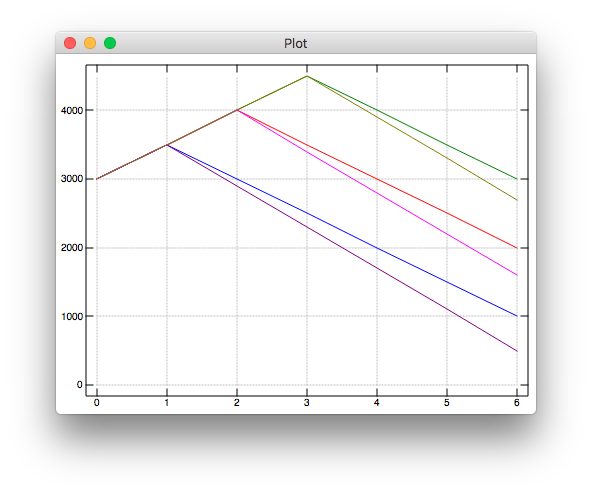
There’s probably a much better way to calculate this and I don’t like how there’s no “0 months of income” plot, but I’m still pretty happy with this graph.
One thing J taught me is just how many tradeoffs are in a programming language. Not just at the level of performance, safety, or semantics, but on a “what is this language for” level. J doesn’t have a lot of “common” language features, like dictionaries or sane conditionals. Instead it has things like first-class array manipulation and simplex generators. I wouldn’t want to use it for web scraping or text munging, but it’s now my favorite tool for calculations. It’s a sort of hybrid of a general purpose language and a DSL. Let’s call it a Specific Purpose Language, where the purpose in this case is “doing stuff to numbers”.
What other special purpose languages do you like? Feel free to email or tweet me your thoughts.
/is also the reduce monad.+/ 1 2 3is1 + 2 + 3. [return]- “Wait, how is that a monad?” Sounds like someone forgot to read the first post! [return]
- This is actually more precise than thinking in flat sums! I can look at my previous bank statements to get a rough sense of my profit. But I can’t just subtract my income to get expenses, because that number will be too low! Things like my transit card are deducted from my paycheck, so I’ll have to start paying that once I’m unemployed. [return]